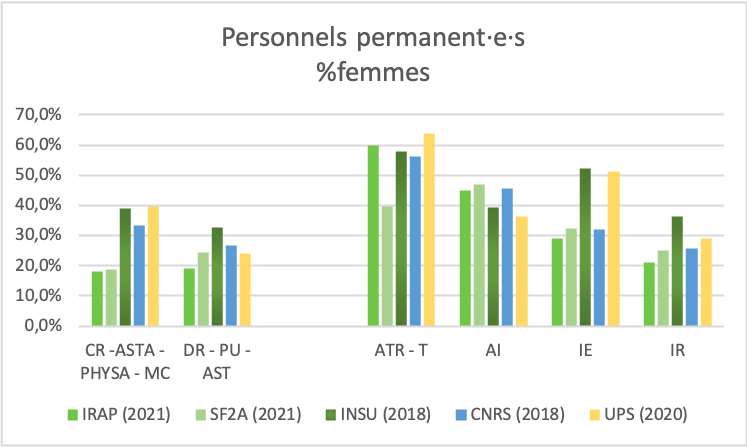
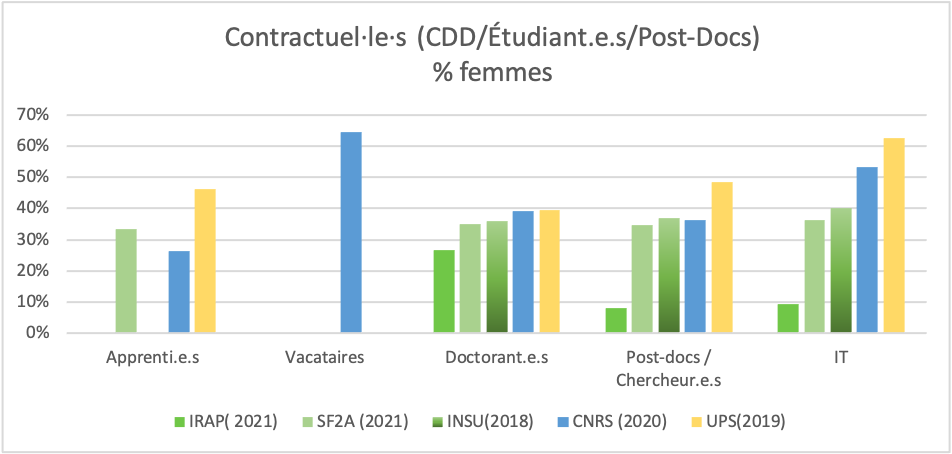
We present you some graphical elements of comparison with IRAP based on data provided by our human ressources department. A summary will be available shortly. These graphs will be refined, possibly accompanied by our comments.
Your comments are welcome.
Raw elements
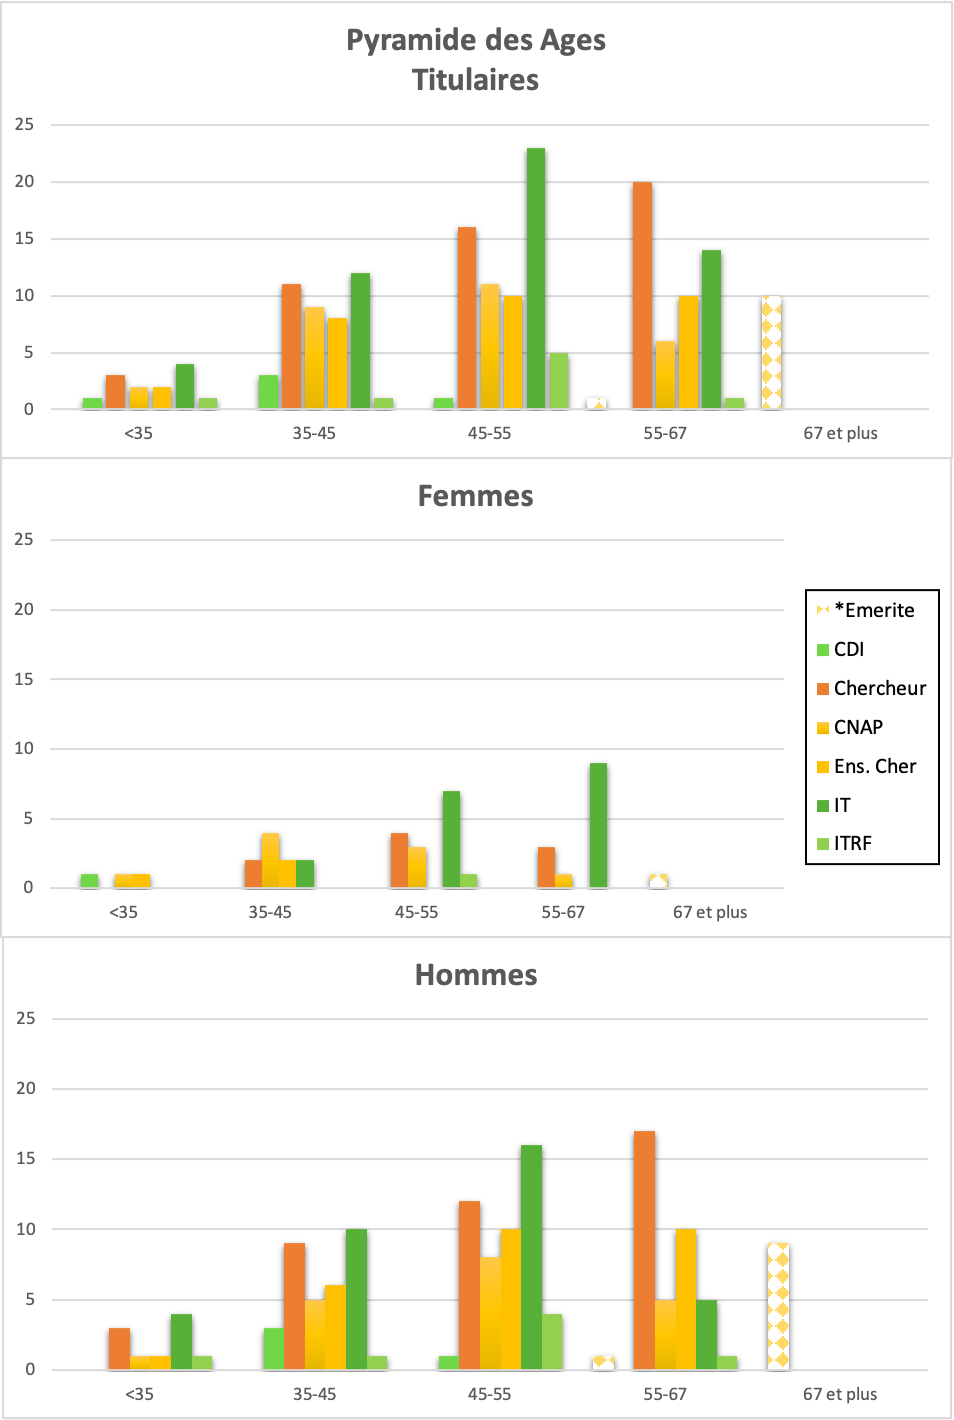
Age pyramid
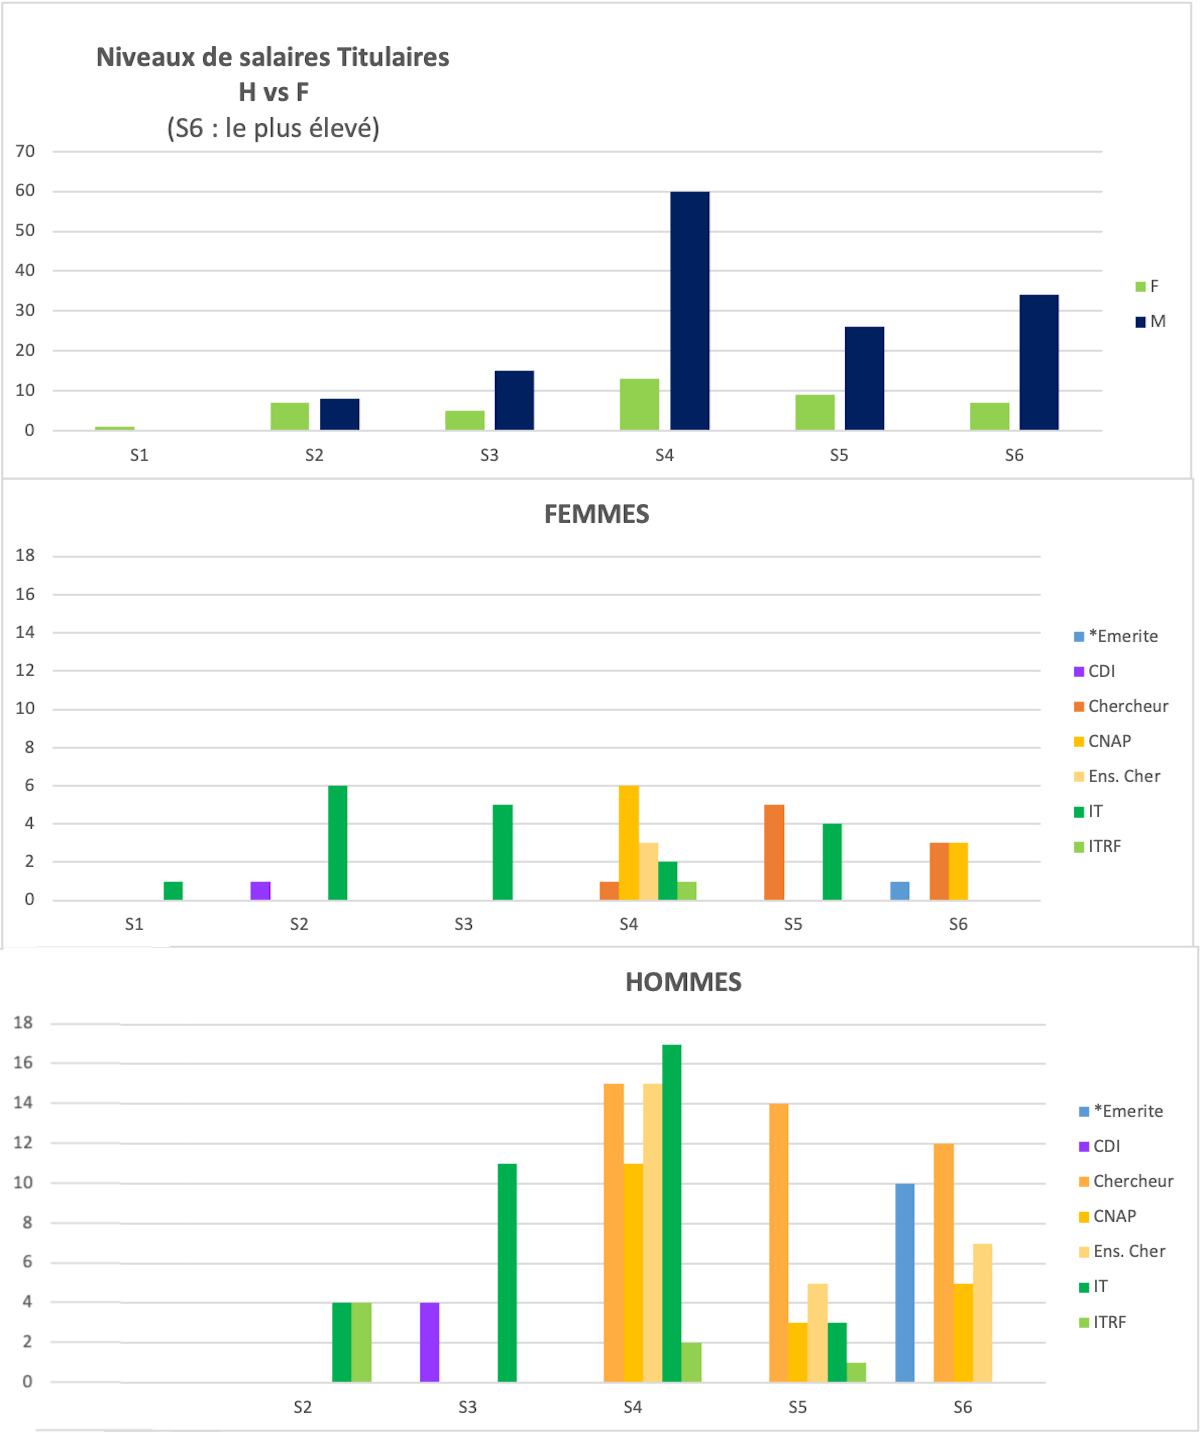
Salary levels
Salary levels have been divided into 6 groups (based on the average index of each level) as follows:
Corps/Grade S1 ADJ, TCN, TCS S2 TCE, AI S3 IECN, IR2
S4 IEHC, IR1, CRCN, MC, PRAGCN, ASTA, PHYSA S5 IRHC, CR1, CRHC, MCHC, DR2, PU2, AST2
S6 DR1, DRCE, PU1, PUCE, AST1, ASTCE, Émerites
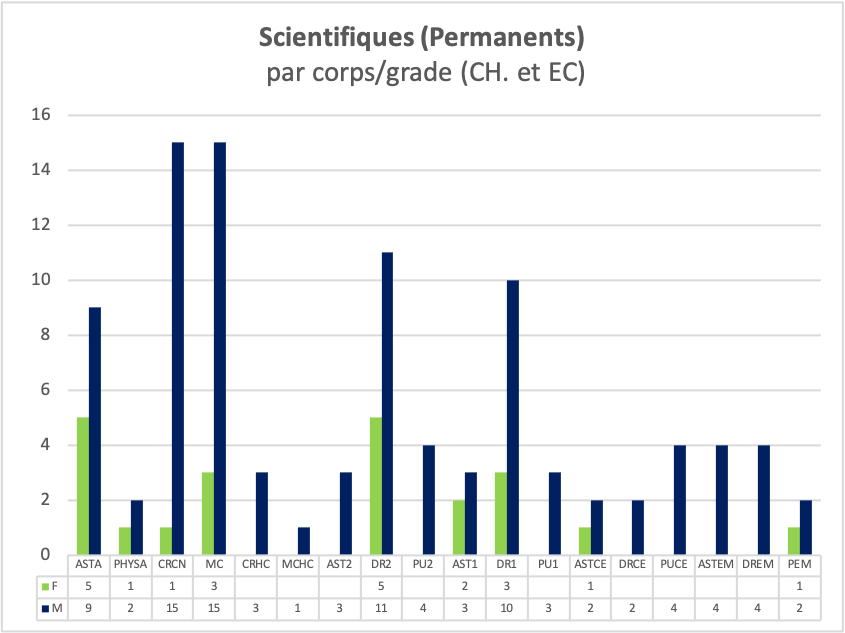
Distribution of Researchers and Teachers Researchers and similar
At IRAP, women full researchers represent:
- 19.4% of permanent scientists from the laboratory
- 20.7% of A-rank scientists from the lab
- 18.2% of B-rank scientists from the lab
Habilitation to supervise research (HDR)
- 63,6% of female researchers hold an HDR (70,1% for men)
- 16.9% of HDRs in the laboratory are held by women
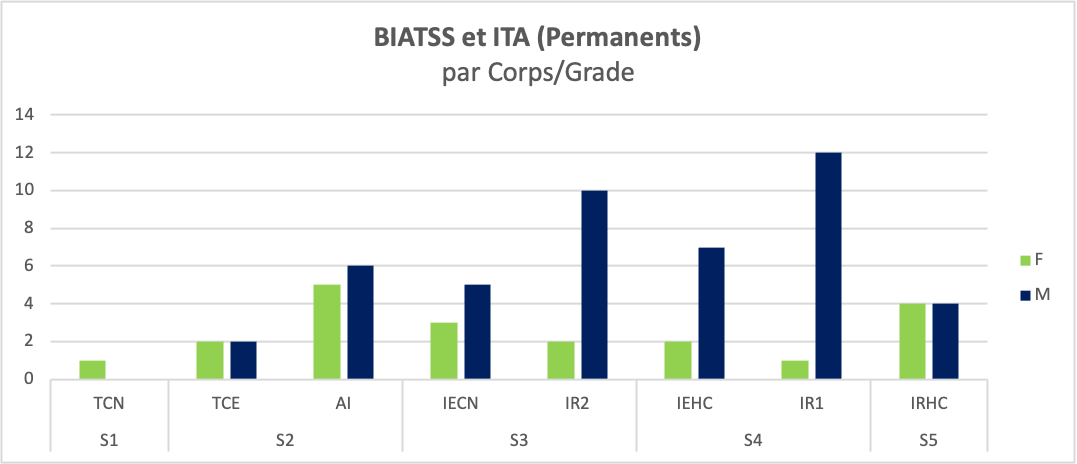
ITA/BIATSS/PRAG
CORPS/GRADE
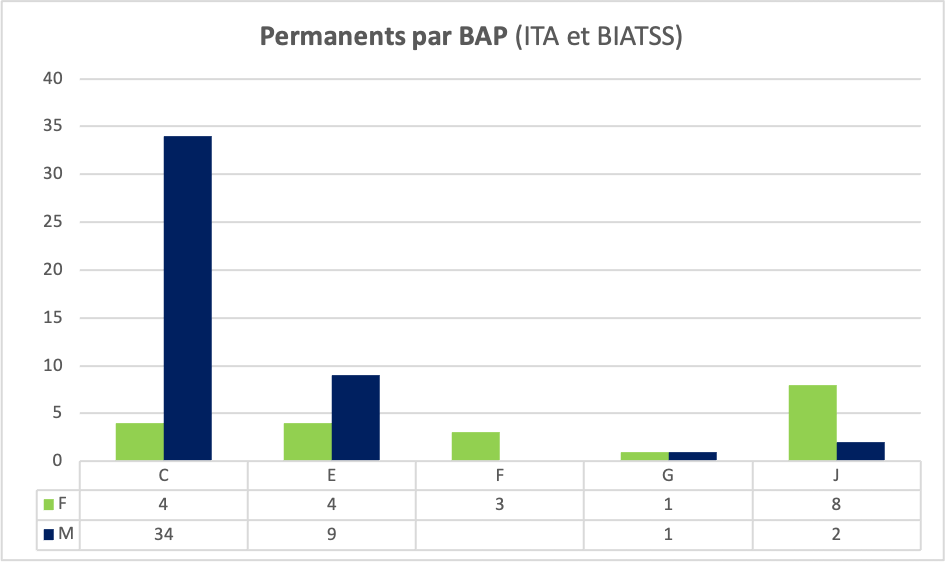
BAP
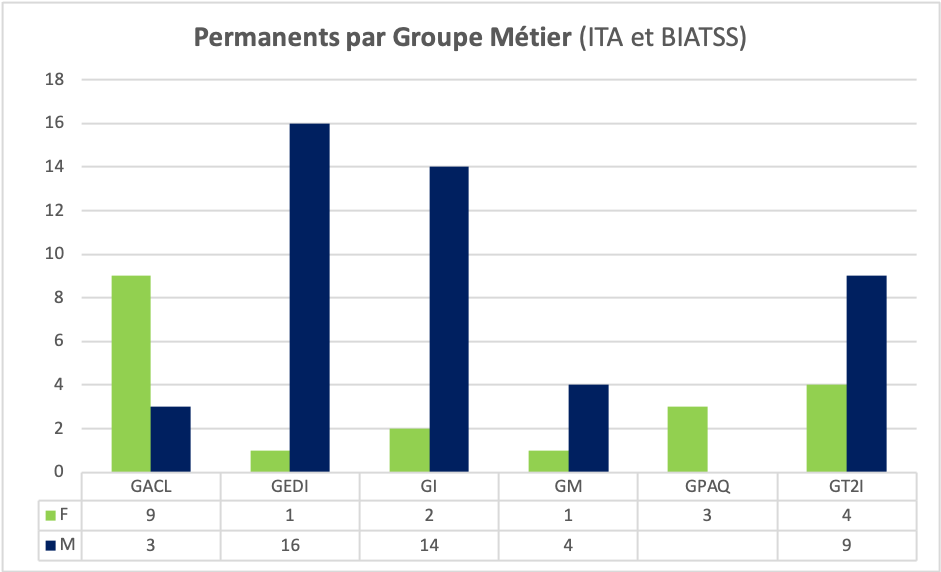
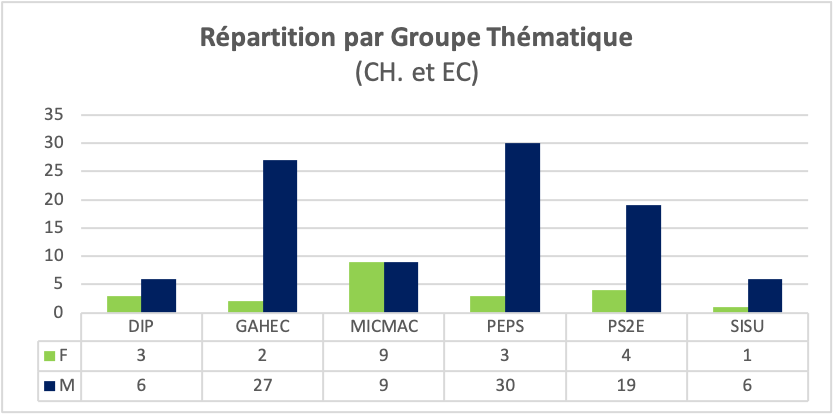
Thematic Groups
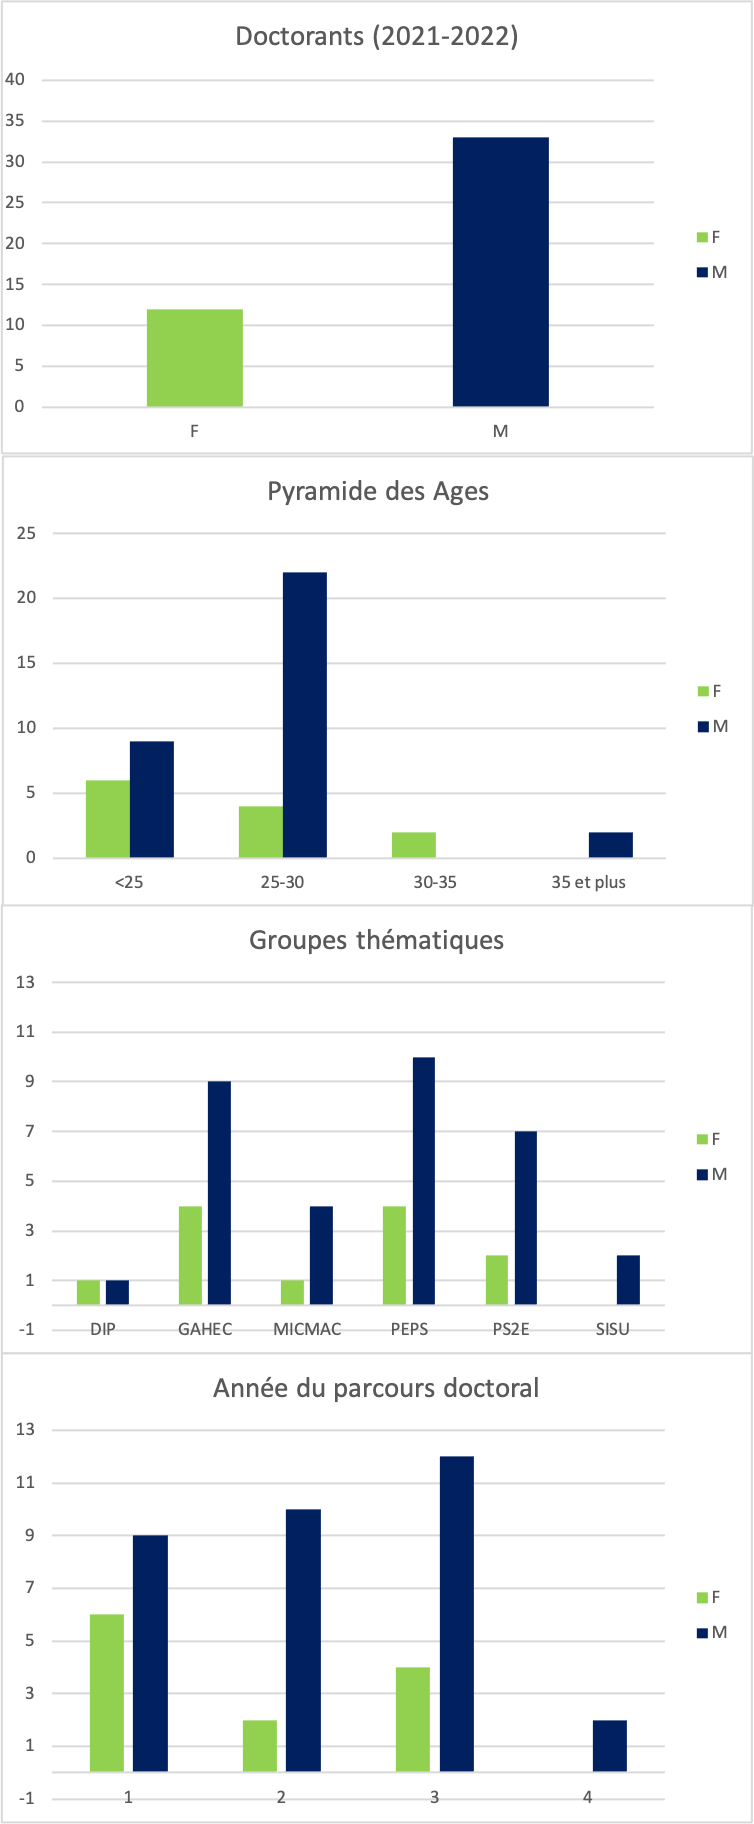
PhD students
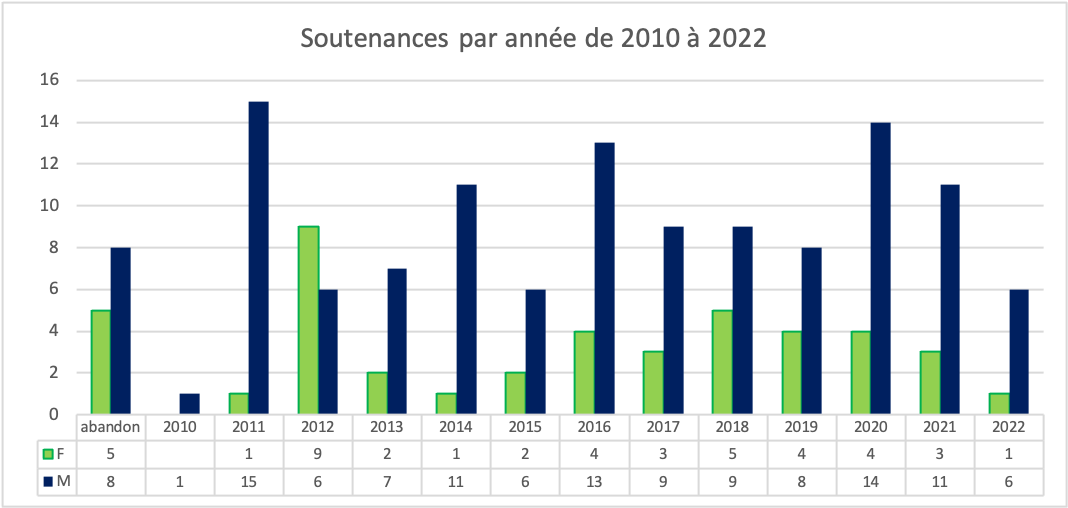
Thesis defended since 2010
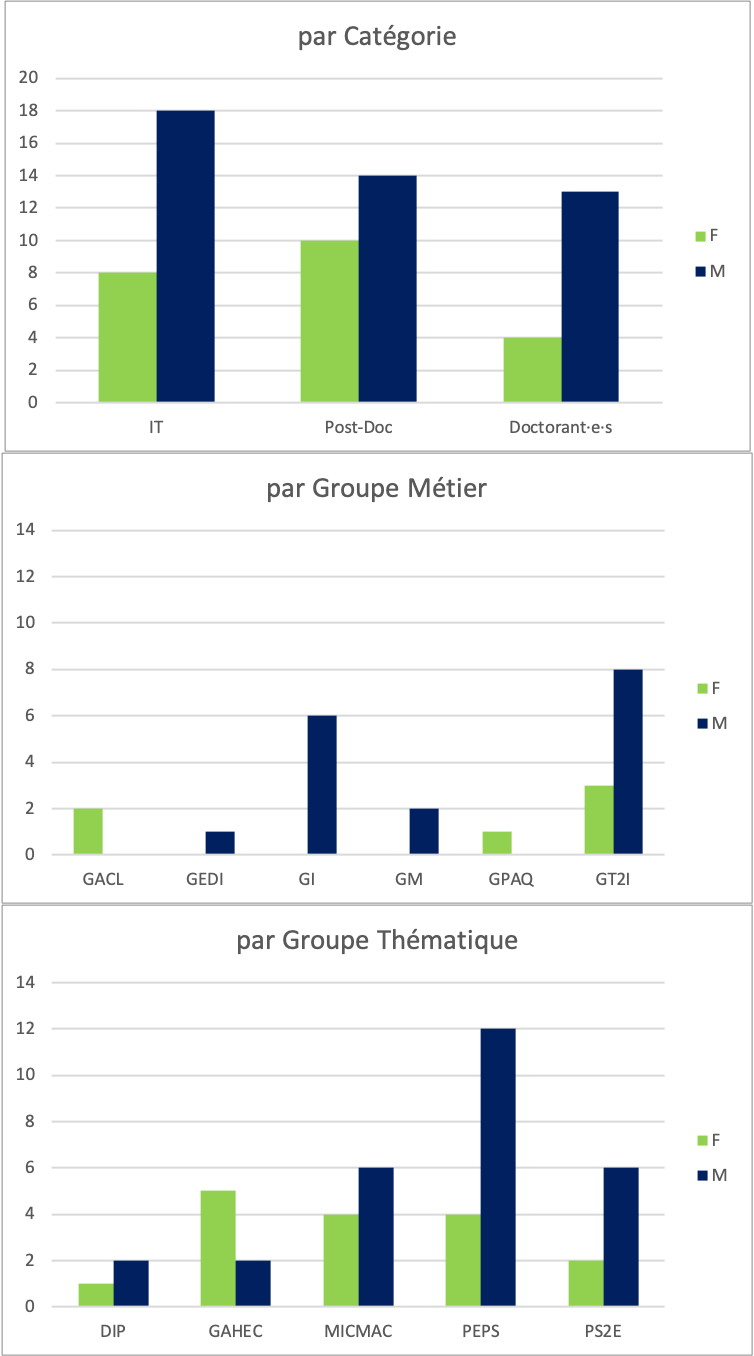
Contractual staff (Post-Docs/CDD)
Indexes/indicators for tenured staff
Glass Ceiling Index
The Glass Ceiling Index (GCI – Glass Ceiling Index) is a relative index comparing, by level, the proportion of women with the proportion of women in senior positions. In academia, higher-level positions are the equivalent of full professors (A-rank : PU, DR, AST and for IT/BIATSS computing, IRHC and IR1).
The formula: ( Nb (F or M)/ totals) /( Nb (F or M) rankA/ Nb (F or H) totals rankA)
| GCI 2022 | ||
|---|---|---|
| Women | Men | |
| Chercheurs/Ens. Cher./CNAP | 0.94 | 1.02 |
| ITA/BIATSS | 1.27 | 0.91 |
- GCI=1: indicates that there is no difference between women and men as to the chance of being promoted.
- CGI < 1: means that women are more represented in grade A than in academia in general (grades A, B and C).
- GCI > 1 indicates that, in proportion to their representation in university staff in general (i.e., all ranks combined), they are less represented in the higher ranks.
Indice d’avantage masculin (IAM)
The Indice d’avantage masculin (IAM) is defined as the ratio of the proportion of A-ranked males among researchers/teacher-researchers and the proportion of A-ranked women among the female/teacher-researchers.
The formula: (A-rank men’s headcount/men’s total headcount)/(A-rank women’s headcount/women’s total headcount)
| IAM 2022 | |
| Cherch./Ens. Cher./CNAP | 0.92 |
| ITA/BIATSS | 1.39 |
- An IAM greater than 1 means that the relative proportion of males promoted to rank A is higher than that of women
Representativeness and responsibilities
Gender mapping in the unit boards
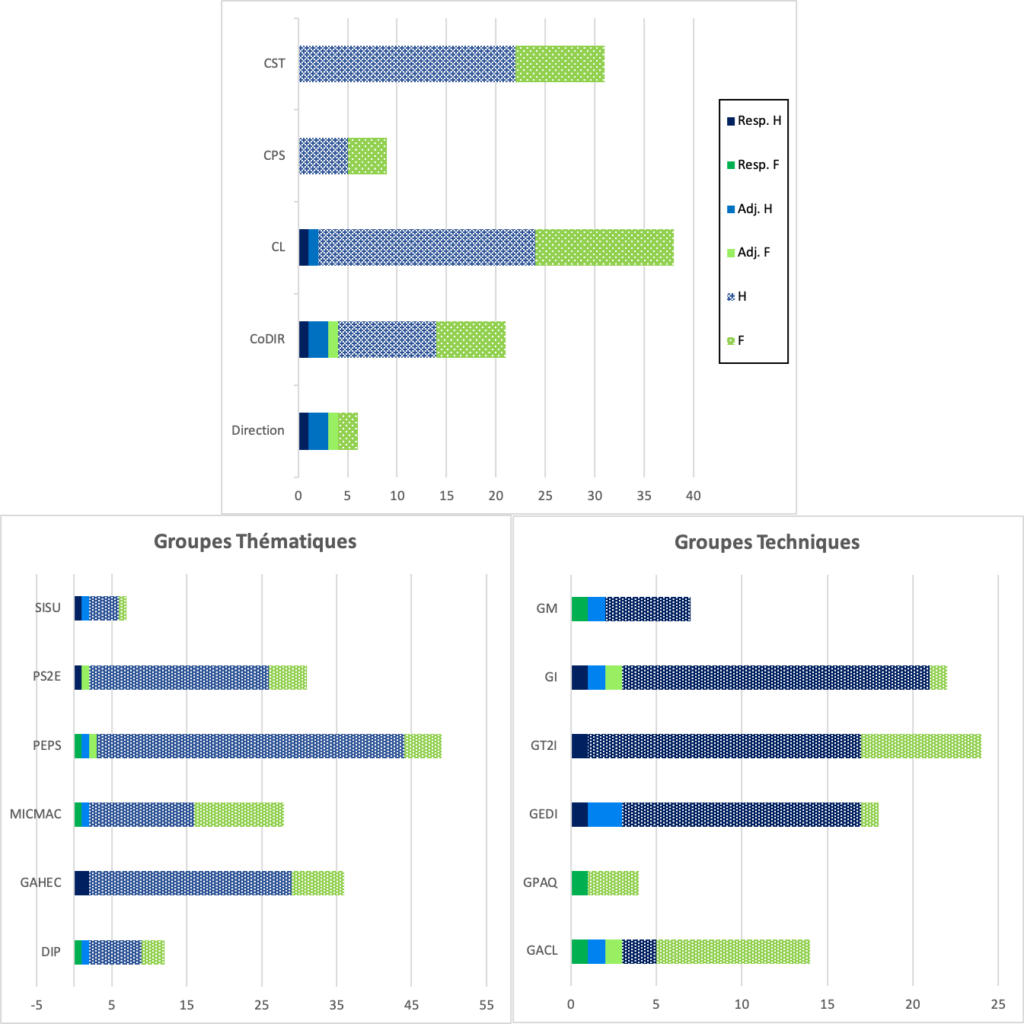
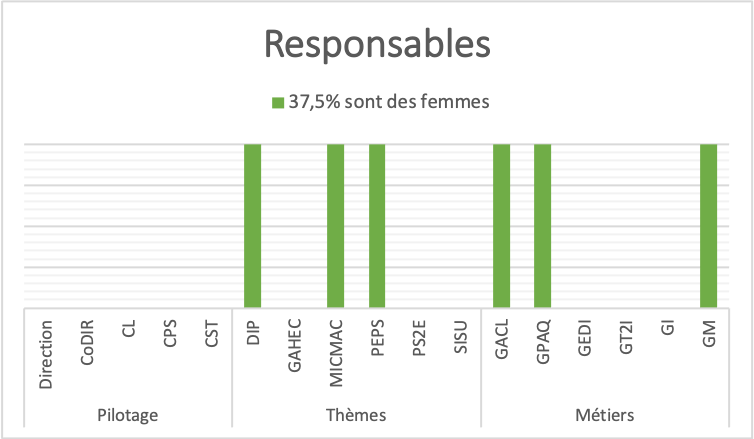
Share of responsibilities held by women
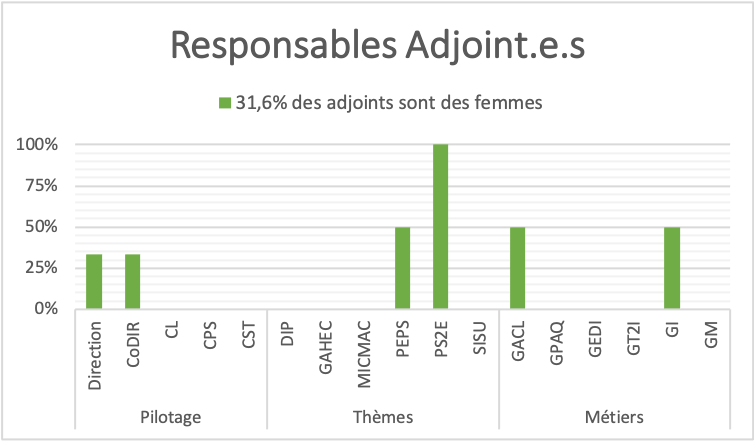
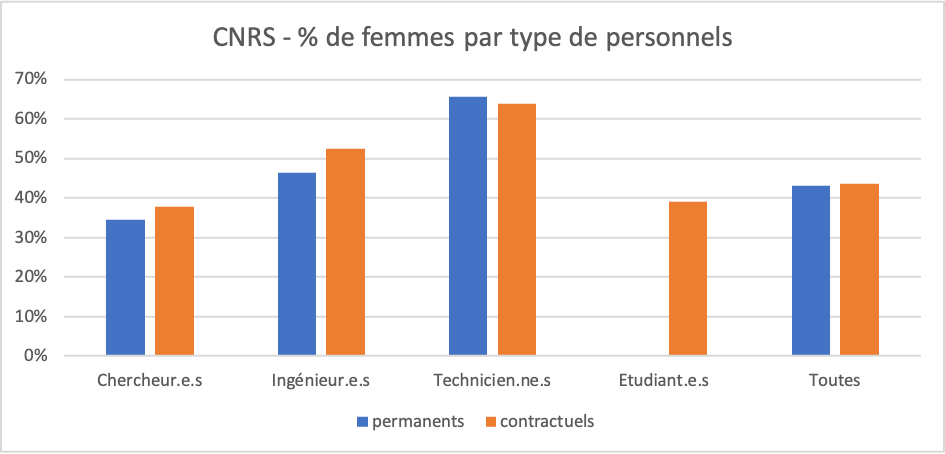
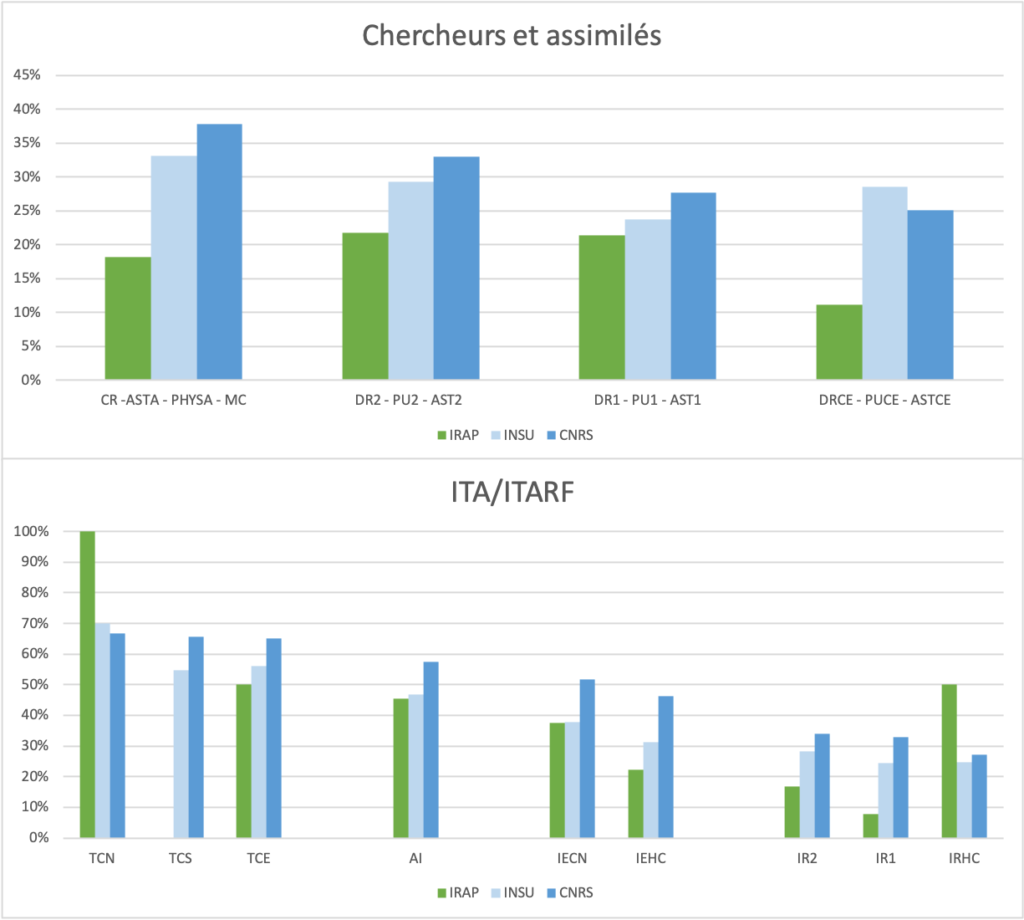
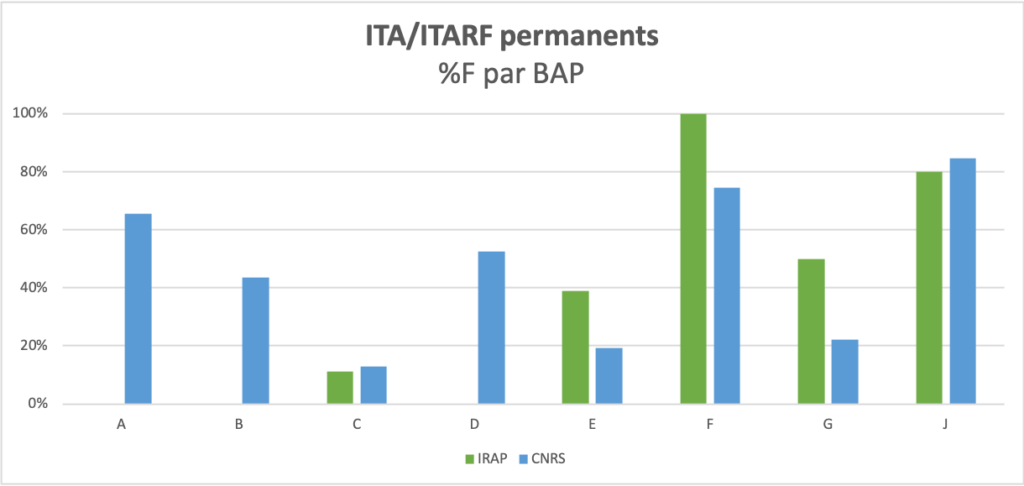
Comparison IRAP vs CNRS
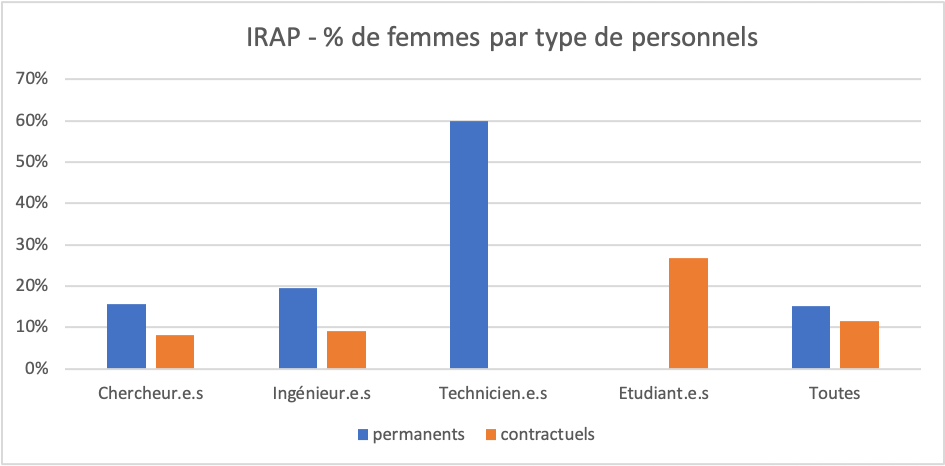
Permanent/contract staff
Corps/Grade
BAP
Comparison IRAP vs SF2A* vs INSU vs CNRS vs UPS
