Exploring planetary plasma environments from your laptop
A new database of plasma simulations, combined with observational data and powerful visualisation tools, is providing planetary scientists with an unprecedented way to explore some of the Solar System’s most interesting plasma environments. This digital space exploration story starts with the Integrated Medium for Planetary Exploration (IMPEx), a collaborative project to create a common data hub for space missions.

While planetary missions are crucial to understand how the solar wind interacts with the magnetospheres of planets and moons in our Solar System, numerical models are, in turn, essential to fully comprehend the measurements and improve our knowledge of planetary plasma environments.
The IMPEx project brought together experts from Austria, France, Finland and Russia to find a common language to combine data from various simulation models and to compare these numerical results with observational data collected by space missions across the Solar System.
It was in this context that a group led by Ronan Modolo at the Laboratoire Atmosphères, Milieux, Observations Spatiales (LATMOS), in France, started developing a collection of plasma simulations at various planetary bodies. The Latmos Hybrid Simulation (LatHyS) database and its uses are presented in a new study published earlier this year in a special issue of Planetary and Space Science.
Modelling celestial environments
The LatHyS database includes a number of simulation results of plasma – the mixture of charged particles that permeates interplanetary space – at selected planets or planetary bodies in our Solar System. The simulations are based on advanced numerical models that take into account a number of complex physical and chemical processes in the upper atmospheres of celestial objects, their interaction with the solar wind and response to solar radiation.
“So far, celestial objects modelled by LatHyS simulations include Mars, Mercury and Jupiter’s moon, Ganymede,” explains Modolo. “We are planning to extend this database to other objects like Saturn’s moon Titan and, in the longer term, to other moons of Jupiter, like Europa or Callisto,” he adds.
The database gives the planetary science community access to simulated plasma data, including electric and magnetic fields, density, temperature and plasma bulk speed. LatHyS, together with a suite of data analysis and visualisation tools, allows researchers to easily combine data from various spacecraft with simulation results, to create 3D images showing how the solar wind interacts with planetary plasma, and much more.
“With a few clicks, the user can get a realistic three-dimensional scene of the plasma environment at the planet and of the spacecraft trajectory, with in-situ measurements enriched by simulation results,” says Dmitri Titov, ESA Mars Express project scientist and a user of the database, who was not involved in the study.
“Users can also use this tool to create animations and, on the scientific side, to visualise the measurements in the context where they had been performed and assist in planning future observations.”
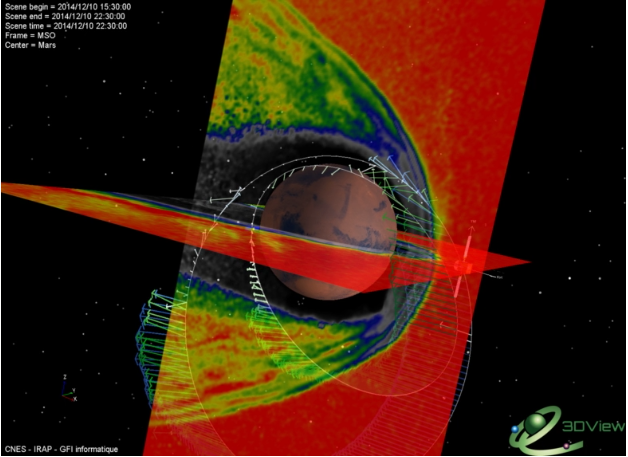
The video starts by showing Mars and the orbits of Mars Express and MAVEN, with results and observations from LatHyS simulations appearing later. The simulated plasma flow vectors (green arrows) are compared to solar wind flow measurements (blue arrows) along spacecraft tracks. Simulated 2D maps of the plasma flow in the XY and XZ Mars-centred planes complement the scene, where the X axis points towards the Sun; these maps illustrate different regions and boundaries around the planet, including the bow shock.
This animation was obtained using the LatHyS set of plasma simulations and the 3DView visualization tool, which were developed as part of the Integrated Medium for Planetary Exploration (IMPEx). Copyright: CNES/IRAP/GFI informatique; LatHyS; 3DView
Seeing the Solar System in 3D
A strength of LatHyS is how well it works with 3DView, a powerful application for displaying science data in 3D. In the current version of the viewer, users can visualise spacecraft trajectories, the positions of planets and other Solar System bodies, among other features. More importantly, because of the integration with IMPEx and LatHyS, 3DView can display scientific data from multiple space missions, as well as from simulations. A new paper led by Vincent Génot of the Institut de Recherche en Astrophysique et Planétologie (IRAP) in Toulouse, France, published in the same issue of Planetary and Space Science, introduces the latest version of the tool and describes in detail how it can be used to display space physics data.
3DView, designed by the French Plasma Physics Data Center (CDPP), was initially developed in 2005 to visualise the trajectory of ESA’s Rosetta spacecraft on its way to the comet. The viewer now comprises some 150 space missions, including Rosetta, Venus Express, and Cassini–Huygens, as well as all planets and moons in the Solar System and a number of asteroids and comets.
“3DView offers the possibility to visualise spacecraft ephemerides – of past, present and future missions – and, when available, observations at all celestial objects in the Solar System explored by space missions equipped with plasma instruments,” says Génot.
One of the main applications of the tool, also in combination with LatHyS, is in helping scientists and engineers during the preparation stages for space missions, allowing them to visualise spacecraft trajectories and the environment at celestial bodies. In 2014, a version of 3DView helped scientists in the selection process of a landing site at Rosetta’s comet for the Philae probe.
While its main target audience is the scientific community, 3DView is also attracting attention as an educational tool. The code is open source and the software is often used in higher-education courses to help students have a better grasp of space physics.
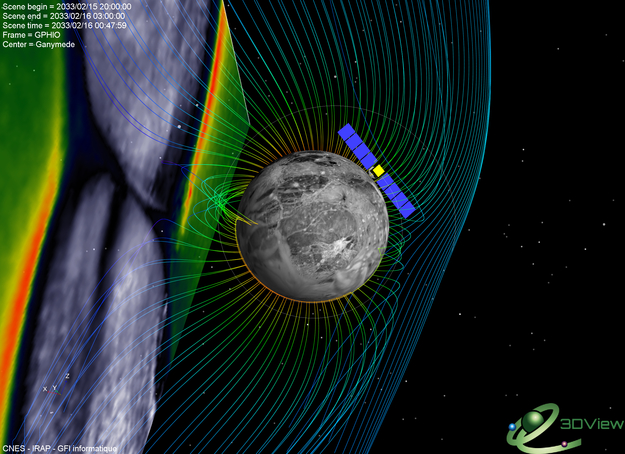
This image was obtained using the LatHyS set of plasma simulations and the 3DView visualization tool, which were developed as part of the Integrated Medium for Planetary Exploration (IMPEx). Copyright: CNES/IRAP/GFI informatique; LatHyS; 3DView
From providing new ways to explore our Solar System to planning future missions and inspiring the next generation of space researchers, LatHyS and 3DView show how much scientists and engineers can gain from combining observations and simulations.
Further Resources
- ESA Press Release : Exploring planetary plasma environments from your laptop
- Scientific Publication : Science data visualization in planetary and heliospheric contexts with 3DView by V. Genot et al.
- 3DView science tool
IRAP Contact
- Vincent Génot, vincent.genot@irap.omp.eu