The surface of Titan seen in the infrared domain by the Cassini probe
Saturn’s largest satellite Titan was overflown 127 times by the Cassini probe between 2004 and 2017. An international team including an IRAP researcher (1) compiled all the data from the VIMS imaging spectrometer in order to create a global map of the surface of Titan in the infrared domain, showing the geological diversity of the terrain. A synthetic video illustrates its main features, from the equatorial dune fields to the impact craters, to the Huygens module landing site.
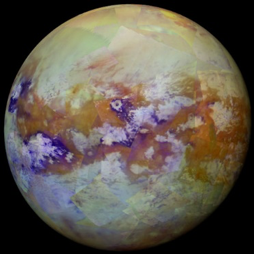
Thirteen years of observations made by the VIMS imaging spectrometer of the Cassini probe were combined to produce a global map of the Titan surface in false colors. The advantage of the VIMS instrument, which records 64×64 pixel images in 352 wavelengths, is that it can observe through atmospheric mist in several infrared “windows” where methane is partly transparent, thus giving access to the surface. Generating homogeneous maps has been a particularly difficult task, due in particular to the effects of the atmosphere which diffuses and strongly absorbs light, effects coupled with the ever-changing observation geometry from one survey to another, as well as with the temporal variations during the 13 years of observation.
It was first necessary to sort and calibrate all the raw images precisely, then to try to reduce the influence of the atmosphere, before obtaining these global maps of the surface at different wavelengths. Combining observations together then makes it possible to highlight the geological diversity and to reveal the main units in terms of composition, at a global scale. The band ratio technique, where an image taken at one wavelength is divided by an image taken at another wavelength, has proven to be particularly effective in highlighting the variations in composition. Within the synthetic video below, showing Titan’s surface in false colours, a large area appears in brown at the equator all around the satellite. This area corresponds to huge dune fields when compared locally to Cassini’s radar images (which cover only two thirds of the surface). Other blue areas appear on this new map, reflecting the presence of soils of different composition, which may be explained by local enrichment in water ice or organic compounds. The Sinlap or Menrva craters, which are shown in the video, are good examples. The integration of the entire VIMS dataset into a synthetic map allows a finer comparison with other observations, such as those of the Cassini probe Radar, or with the images taken by the Huygens module during its landing, as can also be seen at the end of the video. During the data analysis process, preview tools for each individual spectral observation were implemented. Everyone can now easily access in a few clicks to the beauty of Titan’s infrared images (and other ice satellites) using the website https://vims.univ-nantes.fr. Cassini has revealed to us the whole geological richness of Titan, the only body outside the Earth to have rains, rivers, seas, formed by hydrocarbons at 180°C, and not water. Everything we have learned makes us want to go back with new means of investigation.
Note
- The French laboratories involved are the Laboratoire de Planétologie et Géodynamique (LPG, CNRS/Univ. Angers/Univ. Nantes), the IPGP (IPGP, Université Paris Diderot/CNRS), and the IRAP (CNRS/Université Paul Sabatier-Toulouse III).
Further Resources
- Publication : S. Le Mouélic, T. Cornet, S. Rodriguez , C. Sotin, B. Seignovert, J.W. Barnes, R. H. Brown, K. H. Baines, B. J. Buratti, R. N. Clark, P. D. Nicholson, J. Lasue, V. Pasek, J. M. Soderblom (2019) The Cassini VIMS archive of Titan: From browse products to global infrared color maps, Icarus, 319, doi:10.1016/j.icarus.2018.09.017 (arxiv.org/abs/1809.06545)
- The surface of Titan viewed by the infrared spectro-imager VIMS of the Cassini probe : https://www.youtube.com/watch?v=fYE1FS06Ldg&feature=youtu.be
- Visualisation of the VIMS images of the Cassini probe : https://vims.univ-nantes.fr/
IRAP Contact
- Jeremie Lasue, jeremie.lasue@irap.omp.eu